Reading Your Scan Curve: What Time-of-Day and Day-of-Week Data Is Telling You
Five recognisable QR scan curve shapes, what each one usually means, and what to actually do about it.
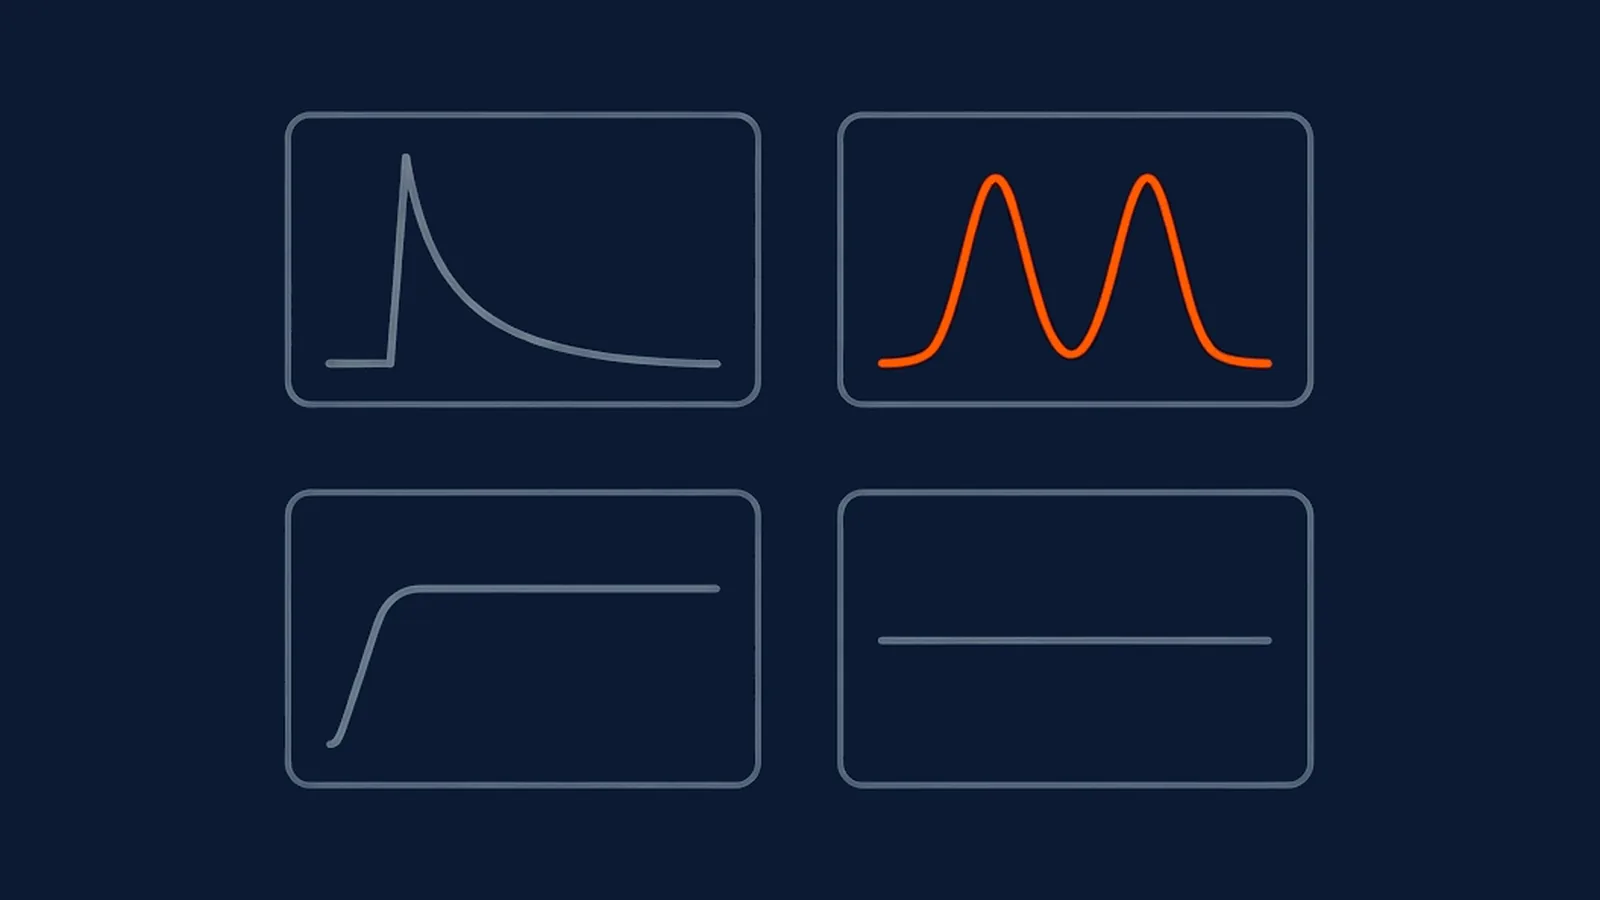
A total scan count answers "how many." The time series behind that total, read from your own analytics, answers a more useful question: what pattern of behaviour actually produced that number. Five curve shapes recur often enough across QR placements to be worth naming and diagnosing individually, because the fix for one looks nothing like the fix for another, even when the total scan count on the same day looks identical.
The five shapes at a glance
| Shape | What it looks like | Typical cause | What to check first |
|---|---|---|---|
| Print-burst decay | Fast spike, then steady decline over days or weeks | Freshest audience scans earliest; remainder shrinks daily | Whether the decay rate matches the placement's expected lifespan |
| Commuter double-peak | Two daily peaks, morning and evening, with a lull between | Placement tied to a fixed daily routine or transit route | Whether the destination fits a short window of attention |
| Weekend plateau | Steady or rising scans on Saturday and Sunday | Audience's real presence pattern at that physical location | Whether campaign timing matches this rhythm |
| Dead flatline | Scans at or near zero throughout | Placement not seen, not sized right, or not paused at | The placement itself, before the creative |
| Single unexplained spike | One sharp peak with no buildup or decay around it | An external event, a location cluster, or non-human traffic | Whether an identifiable cause exists before treating it as a trend |
Print-burst decay
The shape: a fast spike in the first day or two after the placement goes live or a print run first reaches its destination, followed by a steady, gradual decline over the following days or weeks. This is the default shape for most one-time print placements, packaging, flyers, event handouts, because the freshest, most attentive slice of the audience encounters the code earliest, and each day after that draws from a shrinking, increasingly indifferent remainder.
What to do about it: nothing, if the decay tracks roughly the expected lifespan of the placement. It only becomes a genuine concern when the decay is far steeper than expected, tailing off to almost nothing within a day or two on a placement meant to last for weeks, which usually means the audience that ever saw the code was narrower than planned rather than that interest faded unusually fast.
Commuter double-peak
The shape: two distinct daily peaks, typically one in the morning and one in the early evening, with a lull in between and overnight. This shape shows up on placements near transit routes, workplaces, or anywhere tied to a fixed daily routine, a code on a bus shelter or a building lobby being the clearest examples.
What to do about it: match the destination's weight to the moment. A commuter glancing at a code during a five-minute wait for a train has a narrow window of attention twice a day; a destination that assumes a longer, more relaxed session will lose most of that audience regardless of how compelling the offer is. This shape is also a signal to check where the code was placed against the realistic dwell time that spot actually offers, since a double-peak pattern with a low overall scan rate often means the placement is fine but the destination is mismatched to the moment.
Weekend plateau
The shape: scans that hold roughly steady or even rise across Saturday and Sunday, in a placement whose weekday pattern looked more like a workday routine. This is common for retail, hospitality, and leisure placements, where a weekday dip and a weekend plateau simply reflect when people are actually present at that physical location, shopping, dining, or visiting, rather than any change in the code's effectiveness.
What to do about it: use this shape to plan restocking, staffing, or campaign timing around a placement's real usage rhythm rather than an assumed one. A retail placement showing a weekend plateau is telling you when its audience actually shows up, which is worth building the next campaign's launch date around rather than defaulting to a weekday start out of habit.
Dead flatline
The shape: scans at or near zero across the placement's entire run, with no meaningful peak at any point. This is the shape that tempts a rewrite of the call-to-action first, and that's usually the wrong place to start.
What to do about it: check the placement itself before touching the creative. Confirm the code is actually visible from where people stand, sized correctly for the realistic scanning distance at that spot, printed with enough contrast to be read, and positioned somewhere a person naturally pauses rather than passes at speed. A flatline is a placement failure far more often than a wording failure, because a code nobody notices in the first place never gets close enough to a call-to-action to be persuaded or unpersuaded by it. Only once the placement itself is confirmed sound is a creative or offer change the right next experiment.
Single unexplained spike
The shape: one day, or one narrow window, showing scans well above every other point in the curve, with no clear buildup or decay around it. This is the shape most likely to be misread as a sudden success worth repeating, when it may not reflect the placement's normal behaviour at all.
What to do about it: look for an external cause before drawing a conclusion. A social media mention, a nearby event drawing an unusual crowd past the placement, a batch of scans clustered from one shared location or device pattern, or automated, non-human traffic can all produce a spike with nothing to do with the placement's ordinary performance. Treat an unexplained spike as something to investigate, not a new baseline to plan around, until you can point to what actually caused it.
The timezone trap
Scan timestamps are recorded at the moment the redirect happens, and the timezone they're recorded in is not automatically the timezone you view your report in. A curve that shows an odd overnight cluster of scans, or a pattern that seems to start hours before a physical placement could plausibly have opened for the day, is very often a timezone mismatch rather than a real behavioural pattern: the underlying scans happened during ordinary daytime hours in your actual market, but the report is displaying them against a different reference timezone.
This is worth checking as a matter of habit before drawing any conclusion from when scans happened, not only when a pattern looks obviously wrong. A shifted curve that's off by a few hours can still look plausible at a glance, quietly turning an evening peak into what looks like a late-afternoon one, and leading to a placement or staffing decision built on a pattern that never actually happened at that time.
The trap is easiest to catch by anchoring on one known event. If a placement launched at a specific, remembered hour, its first scan should appear close to that hour once the report's timezone is correctly understood. A first recorded scan that lands five or six hours away from when the code was actually first visible to anyone is the clearest sign the report is being read in the wrong timezone, and it's a five-minute check worth doing before any of the five curve shapes above are diagnosed from the data.
What this means for your next campaign
Name the shape before deciding what to change. A decaying burst on a one-time placement usually needs nothing at all. A double-peak needs a destination sized to a short window of attention, twice a day. A weekend plateau is a scheduling cue, not an anomaly. A flatline sends you to the placement itself, not the wording. A single spike sends you looking for a cause before you build a plan around it. Confirm your report's timezone before any of this analysis begins, since a shape read in the wrong timezone can manufacture a pattern that isn't real. None of these diagnoses require a bigger dataset than a single campaign's total and unique scan counts already give you, read over time rather than as one final total, and the same shape-recognition habit is exactly what turns a scan-rate benchmark from an abstract industry figure into a specific, actionable read on your own placement.
Straight answers
What does it mean if QR scans spike right after launch and then fade quickly?
That's a print-burst decay curve, and it's the expected shape for most one-time placements: a fast spike as the freshest audience encounters the code, then a steady decline as the initial audience is exhausted. It only becomes a concern if the decay happens far faster than the placement's expected lifespan, which usually points to a placement that only a narrow, already-passing audience ever saw.
Why does my QR scan data show two peaks in a single day?
A commuter double-peak, with clusters around the morning and evening commute, is common for placements near transit routes, workplaces, or anywhere tied to a fixed daily routine. It's a sign the placement is being seen by people moving through a routine journey rather than deliberately seeking it out, which is useful context for deciding what a scanner has time to engage with in that moment.
Is it a problem if a QR code gets almost no scans at all?
A flatline is usually a placement problem, not a creative one, and it's worth checking in that order. Before rewriting the call-to-action, confirm the code is actually visible, sized correctly for its scanning distance, and positioned somewhere people naturally pause. Creative changes rarely rescue a code nobody is stopping in front of long enough to notice.
What is the timezone trap in QR scan data?
It's treating scan timestamps as if they're automatically in your local reporting timezone when they may be recorded in a different one, commonly UTC. A curve that looks like a strange overnight spike can simply be your normal daytime pattern viewed in the wrong timezone. Always confirm which timezone a report's timestamps use before drawing a conclusion from when scans happened.
What should I do about a single unexplained spike in scans?
Check for an external cause before assuming the placement suddenly started working: a social media mention, a competitor's stunt drawing attention nearby, a batch of scans from one shared location, or simple bot or crawler traffic. A single spike with no clear before-and-after pattern is data worth investigating, not a trend worth building a strategy around.