Total Scans vs Unique Scans: Why Your QR Report Is Double-Counting
Total and unique scans answer different questions. Here's how uniqueness is actually estimated, and which number to put in a client report.
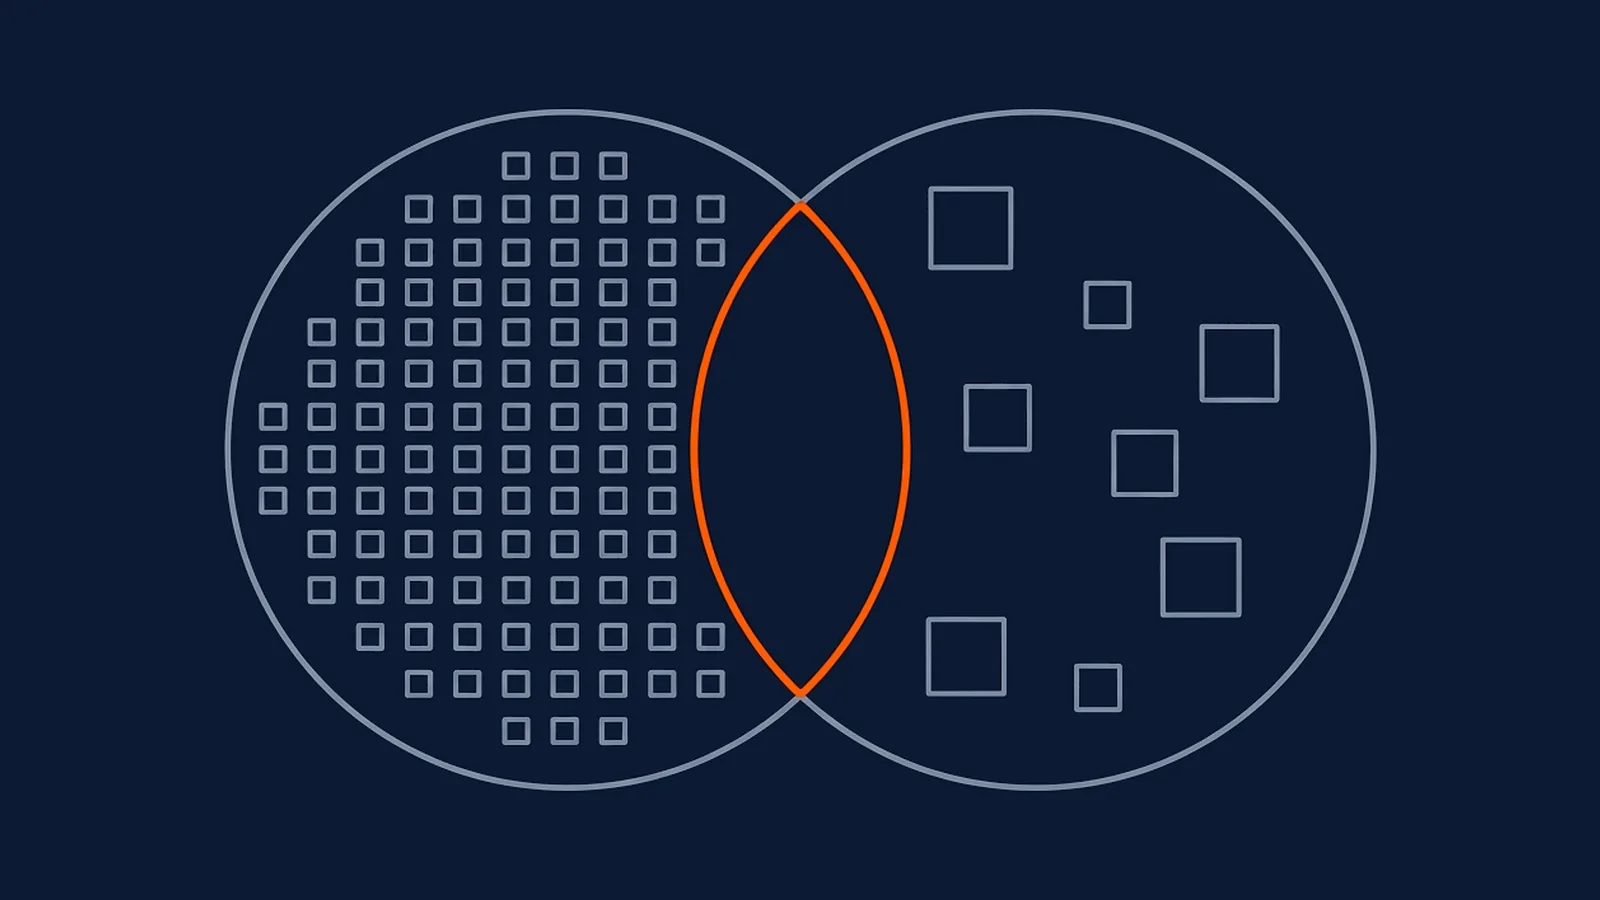
A QR code report showing 3,400 scans and 2,150 unique scans is not one number with a typo. It's two different measurements of the same campaign, and mixing them up is the single most common misread in QR reporting. Total scans counts every scan event that happened; unique scans counts how many distinct visitors produced those events. A code scanned once by 2,150 different people and a code scanned an average of 1.6 times each by those same 2,150 people produce an identical unique count and a very different total, and only one of those two stories is the one worth telling a client.
What each number is actually counting
Total scans is simple: every time the code is scanned and the redirect fires, the counter goes up by one, regardless of who did the scanning or whether they'd scanned it before. It's an event count, and events can repeat indefinitely from the same source.
Unique scans is an estimate of distinct visitors. The mechanism behind it is common across QR and link-tracking tools generally: the first time a given device scans a given code, the platform notes a signal from that device (typically stored client-side, in the browser that opens after the redirect). A later scan from a device carrying that same signal is recognised as a repeat visit and counted once, already, rather than added again to the unique total.
That mechanism is also why "unique" is an estimate and not a certified headcount. The same person scanning from a personal phone and then again from a work phone looks like two different visitors, because the signal lives on the device, not the person. Clearing browser data, switching between two camera apps that each open their own browsing context, or scanning on a shared device that several people use in turn can all push the unique count away from the true number of people, in either direction. Treat it as the closest available proxy for reach, not as ground truth.
This is worth stating plainly because it's easy to present a unique-scan figure with more confidence than it earns. A retail shelf-edge code scanned mostly on personal phones will produce a fairly reliable unique count. The same code taped to a shared kiosk in a waiting room, scanned by a dozen different people over a day on the one device sitting there, will under-count badly, since every one of those scans looks like the same returning visitor. Neither number is wrong in the sense of being calculated incorrectly; the estimate is only as good as the assumption that one device roughly equals one person, which holds most of the time and breaks in specific, identifiable situations.
Why this matters more than it looks like it should
Marketers who have worked with web analytics for years already carry an instinct for this distinction from sessions and users. QR reporting deserves the same instinct, and often doesn't get it, because a single scan count on a slide looks authoritative regardless of which of the two numbers it actually is. The nine metrics worth tracking on a QR code all inherit this same total-versus-unique split in one form or another; getting the distinction right on this one number is what makes the rest of a QR report trustworthy rather than merely impressive-looking.
One campaign, shown both ways
| Reading | Total scans | Unique scans | What it tells you |
|---|---|---|---|
| Campaign week 1 | 1,180 | 1,050 | Most scans are first-time visits; low repeat behaviour |
| Campaign week 4 (destination unchanged) | 3,400 | 2,150 | Cumulative reach growing, but the gap between totals and uniques is widening |
| Same code, if destination were a repeatable resource | 3,400 | 2,150 | Identical numbers, opposite interpretation: this gap now reads as engagement, not friction |
The two right-hand columns in the last two rows are deliberately identical. The table exists to make the point directly: total and unique scans on their own don't tell you whether a gap is good news. What the destination is built to do is what turns the same pair of numbers into either a healthy sign or a diagnostic flag.
When total higher than unique is good news
A QR code on a restaurant table, a product's care instructions, or a WiFi credential is meant to be scanned more than once by the same person. A total scan count several times the unique count on one of these is exactly what a working placement should produce: repeat visits to a resource someone finds worth returning to. Treating that gap as a problem, and trying to "fix" a menu code so people only scan it once, would be optimising away the thing that made the placement useful in the first place.
When total higher than unique is a warning sign
The same gap on a one-time offer, a limited-time discount, or a single-step signup form means something different, because there's no legitimate reason for one visitor to need several scans. The likely explanations are worth checking in order: a landing page that fails to load or times out, prompting a frustrated re-scan; a destination that doesn't confirm the action was completed, so a visitor scans again to check; or a code that looks broken on the first attempt (poor lighting, a smudged print, low contrast) and gets scanned again once conditions improve. In each case the fix is on the destination or the print quality, not the QR code's positioning or design, and a report that only shows the unique figure would hide the fact that something is worth investigating at all.
The rule for what to report and what to keep
Put unique scans in front of anyone asking "how many people did this reach." It's the number that answers the actual question, and reporting total scans as if it were reach overstates the campaign, sometimes by a wide margin, the moment any repeat scanning is happening at all.
Keep total scans, and specifically the ratio between the two, in your own working view. A total-to-unique ratio close to one tells you almost nobody is returning to the code, worth knowing on a resource meant to be revisited. A ratio climbing well above what the destination's purpose would predict is worth a five-minute check of the landing page before the next print run goes out, since reading a scan curve alongside these two numbers together, rather than either alone, is usually what surfaces the actual cause.
This split also matters the moment a campaign spans more than one placement. A shared code used across a shelf-talker, a receipt, and a counter standee will report one merged total and one merged unique figure, with no way to tell which placement drove the repeat behaviour and which drove first-time reach. Splitting placements into separate codes, one of the simplest habits in QR measurement, is what makes the total-versus-unique comparison meaningful per location rather than only in aggregate.
What this means for your next campaign
Decide, before the campaign runs, what a healthy total-to-unique gap looks like for that specific destination: near 1:1 for anything one-time, meaningfully higher for anything designed to be revisited. Report unique scans as the headline reach number to anyone outside the team. Keep total scans as a standing diagnostic, and check it against the destination's purpose whenever the gap moves in a direction the destination doesn't explain. This single habit catches broken landing pages faster than almost any other analytics check, because it flags the problem from the scan side before a client asks why conversions look thin. Where the campaign spans several codes rather than one, first-party attribution across the set makes this comparison meaningfully easier to do consistently.
Straight answers
Which number should I report to a client: total scans or unique scans?
Unique scans, as the headline reach figure, because it answers the question a client actually has: how many distinct people engaged with this. Keep total scans in your own working notes as a diagnostic number. Reporting total scans alone overstates reach, and reporting only unique scans without also checking the total can hide a landing-page problem worth knowing about.
Why don't total scans and unique scans match, even on a small campaign?
Because they're counting different things. Total scans counts every scan event, so one person who scans three times contributes three. Unique scans counts distinct visitors, so that same person contributes one. Any repeat scanning at all, wanted or not, will make the total exceed the unique count, and the gap is the size of that repeat behaviour.
Is a unique scan count exact, or is it an estimate?
It's an estimate, not a headcount. Platforms infer uniqueness from a signal set on the scanning device the first time it hits a given code, then recognise that signal on later scans. The same person switching phones, clearing app data, or using two apps to scan the same code can register as more than one unique visitor, so treat the number as a close proxy, not a certified count of people.
Can total scans be higher than unique scans for a good reason?
Yes, when the destination rewards repeat visits. A restaurant menu, a WiFi code, or a reference page someone returns to on purpose will naturally rack up totals well above uniques, and that gap is a sign of engagement, not a problem. The same gap on a one-time offer page usually means something else is wrong, which is why the ratio needs context before it means anything.
What does it mean if total scans keep climbing but unique scans barely move?
It usually means a small number of people are scanning repeatedly rather than new people discovering the code, which is either healthy (a menu, a reference sheet) or a warning sign (a broken landing page prompting retries, or a confusing destination people re-scan hoping for a different result). Check the destination itself before assuming the placement is underperforming.