A/B Testing With QR Codes: Two Codes, One Campaign
The two valid ways to A/B test a QR campaign, why most print tests are directional rather than statistically significant, and the mistake that ruins both.
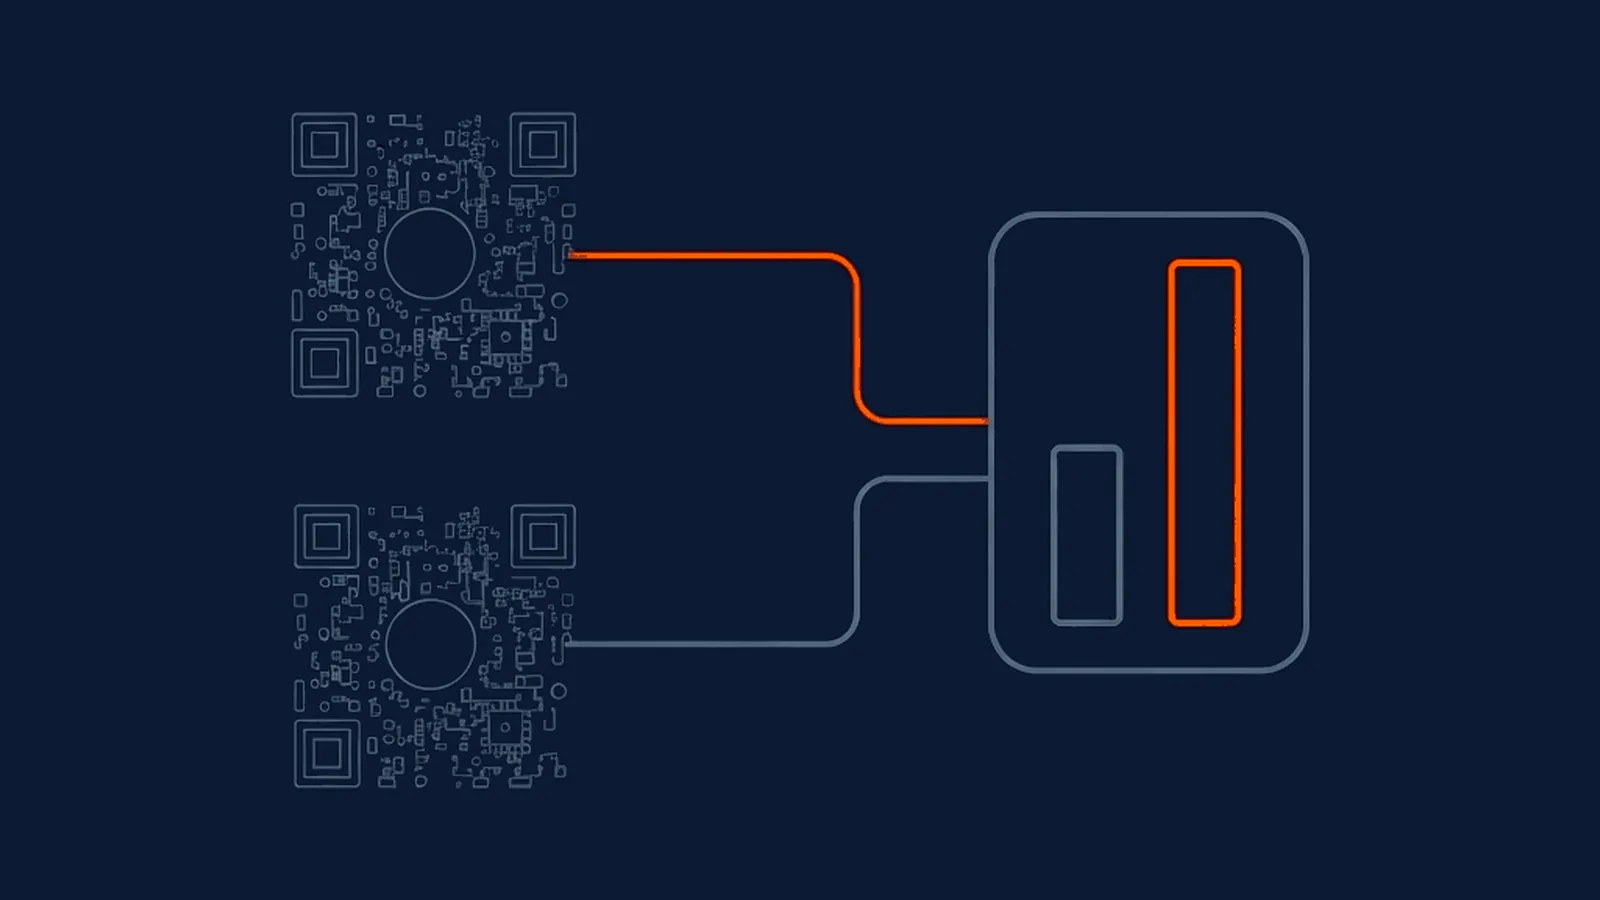
Print advertising has historically resisted testing in a way digital advertising never had to, because there was no way to tell which of two versions of a poster or a leaflet actually performed better once both were already in the world. A QR code changes that, since each code can carry its own tag and report its own scan count, which means two versions of the same printed piece can finally be compared against each other using real data rather than a guess about which one felt stronger. The comparison is only as good as the design behind it, though, and a surprising number of QR-based tests are set up in ways that quietly guarantee an unreliable answer.
The two valid designs
| Design | What it isolates | What it requires | Best used when |
|---|---|---|---|
| Two codes, two creatives | The difference between two versions of the artwork, wording, or offer, each printed with its own code | Two separate dynamic codes, each on its own copies of the printed material | The audience for each variant can be split physically, two versions of a flyer, two ends of a store, two regions |
| One code, split destination | The difference between two landing experiences, when the same printed artwork reaches everyone | A destination that itself randomly assigns each visitor to a variant, not a QR feature | The printed material can't practically be split into two versions, a single poster run, a single packaging print |
The first design is the simpler of the two and the one most print campaigns should default to. Two versions of the same flyer, poster, or shelf card, each carrying its own dynamic code, let you compare scan counts directly, and because the variants are visibly different pieces of print, you control exactly who sees which one. The trade-off is that it only works when you can actually distribute two versions, side by side on a shelf, split across two locations, alternated across a print run, rather than one single object every visitor encounters.
The second design solves that limitation but shifts the actual splitting work off the code and onto whatever the code points to. The QR code itself stays identical on every copy of the printed material; what varies is that the destination page, not the code, randomly sends each visitor to one of two landing experiences. This is worth stating plainly: a QR platform that only lets you edit a code's destination for everyone at once, changing where the code points, changes it for every future scan, not for a random half of them, cannot perform this kind of split on its own. The random assignment has to live in whatever system serves the landing page. If your printed material can only exist as one design, and you still want to test two landing pages against it, you need a destination capable of doing that split itself, not a QR feature.
Why most print tests are directional, not significant
Telling a genuine difference in performance apart from ordinary random variation takes a meaningful number of scans in each variant, and the exact number needed depends on how big a baseline rate you're starting from and how large a difference you're actually trying to detect, smaller differences and lower baseline rates both demand more scans to detect reliably. A typical print run, a few hundred posters across a handful of locations, a single packaging batch for a regional launch, usually produces total scan counts far below what a rigorous significance calculation would ask for. That doesn't make the test worthless; it means the honest reading of "variant A got 34 scans and variant B got 21" is "A looks like the stronger direction to pursue," not "A is proven to outperform B." Running the same test again on the next print cycle, and seeing whether the direction holds, is what turns a single directional result into something closer to confidence.
This matters most when a test produces a close result. A 34-to-21 split feels meaningful, but at low volumes a comparable gap can appear from ordinary chance alone, the same way flipping a coin twenty times doesn't reliably land at exactly ten and ten. A test that comes back close should be read as inconclusive rather than stretched into a decision, and a test that comes back with one variant scanning several times more than the other is the kind of gap worth acting on even at modest volumes, since a difference that large is less likely to be noise.
A third option sits between these two and is worth naming even though it isn't a true test: running the two variants sequentially, one in the first half of a campaign window and the other in the second, on the same printed piece reprinted with a change. This isn't a controlled comparison, since the audience, the season, and anything else happening around the campaign can all shift between the two halves, but it's sometimes the only option when a single print run genuinely can't be split. Treat a sequential comparison as weaker evidence than either of the two designs above, useful for a rough sense of direction and nothing stronger.
Reporting the result honestly
Whoever asked for the test, a client, a manager, a colleague running the next print cycle, deserves the same honesty about certainty that the test itself deserves. "Variant A scanned noticeably more than variant B, and I'd lead with it next time" is an accurate, useful sentence even at low volumes. "Variant A beat variant B by 62%" stated as settled fact, drawn from a few hundred scans total, implies a level of certainty the underlying numbers don't support, and it sets up an awkward conversation the next time a similar test comes back the other way. Reporting a direction with appropriate confidence, rather than a precise-sounding number with false confidence, is what keeps a testing programme credible over several campaigns rather than just the first one.
Setting up UTM tags per variant
Each variant needs its own consistent tag set, following the same naming convention you'd use for any dynamic code: a shared utm_source and utm_campaign across both variants, so the campaign rolls up together, and a distinct utm_content value per variant that names the specific version, variant-a and variant-b rather than anything that could be confused with the placement itself. Keep the placement recorded separately if both variants appear in more than one location, since mixing "which variant" and "where it was placed" into a single tag makes it impossible to separate a creative effect from a location effect later. This tagging is what actually lets the two codes' analytics be compared side by side after the fact; without it, you have two numbers with no shared frame to read them against.
How long to run the comparison
Run the test long enough to see a full cycle of whatever pattern the placement naturally follows, a full week if the location sees different weekday and weekend traffic, a full event if the placement only exists for the event's duration, rather than stopping the moment one variant pulls ahead. Scan activity over time follows recognisable shapes, and cutting a test short, right after a single strong day for one variant, risks mistaking a temporary pattern for a durable difference. Ending both variants at the same point in their respective cycles, not simply after the same number of calendar days if the two were installed on different dates, keeps the comparison fair.
The mistake that ruins the whole test
Changing more than one variable at a time is the single most common way a QR A/B test produces an unusable result. Testing a new wording alongside a new placement, or a redesigned code alongside a different offer, means that whichever variant wins, you can't say which change actually caused it. The wording sitting next to a code and where that code physically sits are both worth testing, but not in the same run against each other. Hold every variable constant except the one you're actually testing, and if a print run genuinely tempts you to try several ideas at once, run them as a sequence of single-variable tests across successive print cycles instead, using an already-successful mechanic as your control rather than testing everything simultaneously and learning nothing conclusive from any of it.
What this means for your next campaign
Default to two codes and two creatives whenever your printed material can physically exist in two versions, since it's the simpler design and gives you a clean, directly comparable result. Reach for a split-destination design only when the print itself has to stay singular, and go in knowing that split has to live on your landing page, not in the QR code. Read a close result as inconclusive rather than a verdict, read a wide result as a real signal worth acting on, and never let a single test result substitute for a proper benchmark comparison against your own channel history over time.
Straight answers
How many scans do I need before an A/B test result means anything?
More than most single print runs produce. Distinguishing a genuine difference from ordinary noise takes a meaningful number of scans in each variant, and the exact number depends on your baseline rate and how big a difference you're trying to detect. Most standalone print tests fall well short of that, which is why a result should be read as directional evidence to carry into the next campaign, not as a confirmed, final answer.
Can I test more than two creative variants at once?
You can, but each additional variant needs its own code and divides your total scans further, which makes reaching any meaningful sample size even harder at typical print volumes. Two variants is usually the practical ceiling for a single print run; testing a third or fourth idea is often better done as a separate, later test once the first comparison has already narrowed things down.
Should I change more than one thing between my two QR variants?
No. Changing the creative and the placement, or the wording and the code's size, at the same time means a difference in scans can't be attributed to either change specifically. Hold everything constant except the one variable you're testing, even though it's tempting to test several ideas at once when a print run is already underway.
Does a QR platform run the A/B test automatically for me?
No, and be wary of any platform that claims it does. A QR platform's job is per-code analytics, total and unique scans, a time series, top geography and top device, which is what lets you compare two codes against each other after the fact. Designing the two variants, printing them, and applying consistent UTM tagging to each is manual work you have to do yourself, whatever platform you're using.